Level of Traffic Stress (LTS) analysis is an approach to mapping the suitability of streets and pathways for cycling based on the perceived stress level of riding in that environment. Streets and pathways are categorized into four levels of stress ranging from environments suitable for all ages and abilities (very low stress) to high stress conditions. Each level of stress can be associated with the widely accepted bicyclist design user profiles:
- LTS 1: All Ages and Abilities (AAA) – Suitable for all users including children
- LTS 2: Low Stress – Suitable for the “Interested but Concerned” population
- LTS 3: Medium Stress – Suitable for the “Somewhat Confident” group (sometimes referred to as Enthused & Confident)
- LTS 4: High Stress – Suitable only for the “Highly Confident” group (sometimes referred to as Strong & Fearless)
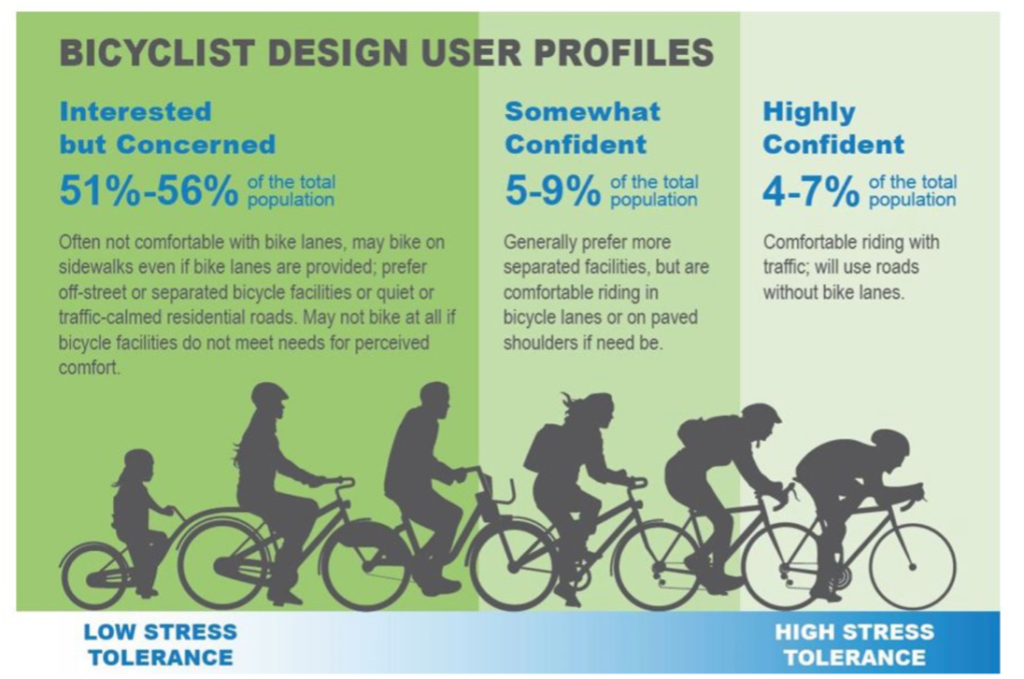
Bicyclist design user profiles as presented by the United States’ Federal Highway Administration. Note that some estimates of these user types identify the “Highly Confident” group to be comprised of as little as 1% of the population. Credit: FHWA, 2019
The LTS methodology was developed by the Mineta Transportation Institute (MTI) in 2012 to create a more user-oriented definition of a cycle network while also developing a metric to examine network connectivity. While I won’t go into the specific details of the methodology, the research team considered the effect of several street design characteristics on the level of stress felt by cyclists to determine an overall LTS value. Several criteria were considered including whether a cycling facility was present, the width of the facility, number of vehicle lanes, speed limit, and on-street parking turnover, among others. While these criteria have been used by other organizations developing an LTS map, there is no single correct method, and the criteria can be adapted to fit the local context wherever it is applied.
The output of an LTS analysis is valuable for planners and the public alike, and I would argue more valuable than the designated cycling network maps municipalities often share and refer to when expanding their network. Cycling network maps are both overly inclusive and exclusive at the same time. While these maps clearly demonstrate cycling routes and their nature, they have no reference to the conditions of the environment. A cycle route defined by sharrows, or a painted bike lane may still be a high stress environment for most riders if the facility is not adequate for the given conditions. On the other hand, local streets without a designation, which may offer a sufficient level of connectivity, are excluded from the cycling network despite often providing a low stress option. By presenting the stress level of every street in the community, an LTS map can more clearly indicate how bike friendly the streets really are.
For planners, LTS maps can be examined to gain a better understanding of how the street network supports the five principles of Dutch cycling network design: cohesion, directness, safety, comfort, and attractiveness. As shown by MTI, network connectivity for a given stress level can be calculated using the percentage of trips or nodes connected, while directness can be quantified by calculating a detour factor for a given stress level. Safety, or the user’s perception of safety, can be inferred based on the LTS value as high stress environments typically lack safe facilities. By conducting an LTS analysis, planners can identify the need for new or upgraded cycling infrastructure and identify which corridors are potential candidates.
LTS maps are also an excellent resource for the public to navigate their community. While experienced cyclists with a strong local knowledge may be well aware of what streets are suitable for their cycling level, newcomers, less confident cyclists, and those venturing outside their usual range may find the greatest value in referring to them. Traditional navigation options, such as Google Maps, offer directions for all modes of transportation but are typically automobile oriented and do not always provide accurate and safe routes for cyclists.
Having lived in several new cities, I have my own experiences of being led astray on my bike in an unfamiliar place. A few years ago, I was in Hamilton, ON for a summer internship and used Google Maps to navigate up the Niagara Escarpment. Despite there being a safer option (which I didn’t realize until I returned from my trip), I was advised to ride up Claremont Access, a 70 km/h, five-lane, divided roadway. By the time I realized the mistake I had made, it was too late to turn around and I ended up dejectedly walking my bike up the trampled grass next to the roadway, clearly not the first to take this route. Had there been an LTS map available to me, I would have avoided this altogether and been happily on my way to my destination. I should note, however, that a protected AT facility has since been implemented on Claremont Access.
 |
 |
Claremont Access in Hamilton, ON in 2019. Note the trampled grass beside the roadway, indicating multiple people have taken this route.
|
Claremont Access in 2021, following the implementation of the Keddy Access Trail, a bi-directional protected multi-use path up the Niagara Escarpment.
|
Having survived my trek up Claremont Access, I now live in Ottawa, ON, and have been here for well over a year. It was just in the last month, however, that I discovered an interactive LTS map for the city developed by the not-for-profit advocacy organization Bike Ottawa. While I am mostly familiar with my new surroundings, I do occasionally use the tool when travelling outside my regular routes and would have found this to be extremely helpful during my first few months in the city. Bike Ottawa also has several other informative maps for Ottawa cyclists including an LTS Route Planner that allows you to select your desired level of stress so you can find a route that suits your cycling comfort level.
Interactive Level of Traffic Stress map for Ottawa developed by the non-profit group Bike Ottawa.
As a planner and someone who cycles almost daily, I believe that Level of Traffic Stress analysis is a vastly underrated tool that can transform how we plan our cycling networks and navigate our communities. My hope is that municipalities across Canada and around the world develop these maps to guide their network planning decisions and guide the public to their destination with a safe, convenient, and low stress route.

Making the Case for Level of Traffic Stress Analysis
Level of Traffic Stress (LTS) analysis is an approach to mapping the suitability of streets and pathways for cycling based on the perceived stress level of riding in that environment. Streets and pathways are categorized into four levels of stress ranging from environments suitable for all ages and abilities (very low stress) to high stress conditions. Each level of stress can be associated with the widely accepted bicyclist design user profiles:
- LTS 1: All Ages and Abilities (AAA) – Suitable for all users including children
- LTS 2: Low Stress – Suitable for the “Interested but Concerned” population
- LTS 3: Medium Stress – Suitable for the “Somewhat Confident” group (sometimes referred to as Enthused & Confident)
- LTS 4: High Stress – Suitable only for the “Highly Confident” group (sometimes referred to as Strong & Fearless)
Bicyclist design user profiles as presented by the United States’ Federal Highway Administration. Note that some estimates of these user types identify the “Highly Confident” group to be comprised of as little as 1% of the population. Credit: FHWA, 2019
The LTS methodology was developed by the Mineta Transportation Institute (MTI) in 2012 to create a more user-oriented definition of a cycle network while also developing a metric to examine network connectivity. While I won’t go into the specific details of the methodology, the research team considered the effect of several street design characteristics on the level of stress felt by cyclists to determine an overall LTS value. Several criteria were considered including whether a cycling facility was present, the width of the facility, number of vehicle lanes, speed limit, and on-street parking turnover, among others. While these criteria have been used by other organizations developing an LTS map, there is no single correct method, and the criteria can be adapted to fit the local context wherever it is applied.
The output of an LTS analysis is valuable for planners and the public alike, and I would argue more valuable than the designated cycling network maps municipalities often share and refer to when expanding their network. Cycling network maps are both overly inclusive and exclusive at the same time. While these maps clearly demonstrate cycling routes and their nature, they have no reference to the conditions of the environment. A cycle route defined by sharrows, or a painted bike lane may still be a high stress environment for most riders if the facility is not adequate for the given conditions. On the other hand, local streets without a designation, which may offer a sufficient level of connectivity, are excluded from the cycling network despite often providing a low stress option. By presenting the stress level of every street in the community, an LTS map can more clearly indicate how bike friendly the streets really are.
For planners, LTS maps can be examined to gain a better understanding of how the street network supports the five principles of Dutch cycling network design: cohesion, directness, safety, comfort, and attractiveness. As shown by MTI, network connectivity for a given stress level can be calculated using the percentage of trips or nodes connected, while directness can be quantified by calculating a detour factor for a given stress level. Safety, or the user’s perception of safety, can be inferred based on the LTS value as high stress environments typically lack safe facilities. By conducting an LTS analysis, planners can identify the need for new or upgraded cycling infrastructure and identify which corridors are potential candidates.
LTS maps are also an excellent resource for the public to navigate their community. While experienced cyclists with a strong local knowledge may be well aware of what streets are suitable for their cycling level, newcomers, less confident cyclists, and those venturing outside their usual range may find the greatest value in referring to them. Traditional navigation options, such as Google Maps, offer directions for all modes of transportation but are typically automobile oriented and do not always provide accurate and safe routes for cyclists.
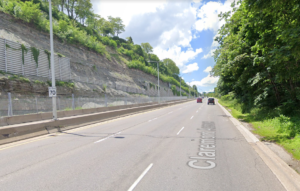
Having lived in several new cities, I have my own experiences of being led astray on my bike in an unfamiliar place. A few years ago, I was in Hamilton, ON for a summer internship and used Google Maps to navigate up the Niagara Escarpment. Despite there being a safer option (which I didn’t realize until I returned from my trip), I was advised to ride up Claremont Access, a 70 km/h, five-lane, divided roadway. By the time I realized the mistake I had made, it was too late to turn around and I ended up dejectedly walking my bike up the trampled grass next to the roadway, clearly not the first to take this route. Had there been an LTS map available to me, I would have avoided this altogether and been happily on my way to my destination. I should note, however, that a protected AT facility has since been implemented on Claremont Access.
|
|
Claremont Access in Hamilton, ON in 2019. Note the trampled grass beside the roadway, indicating multiple people have taken this route.
|
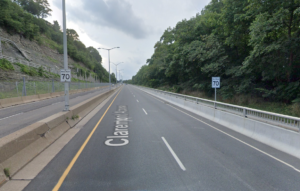
Claremont Access in 2021, following the implementation of the Keddy Access Trail, a bi-directional protected multi-use path up the Niagara Escarpment.
|
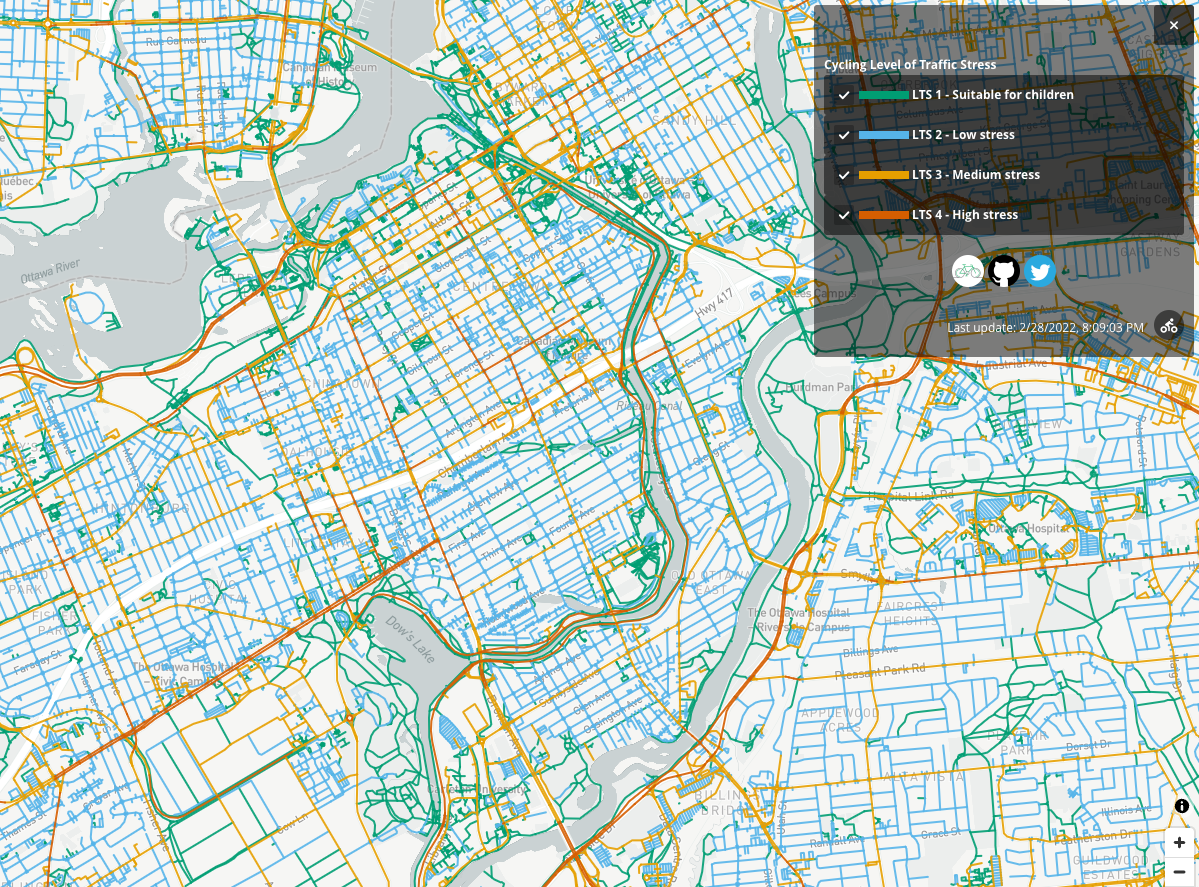
Having survived my trek up Claremont Access, I now live in Ottawa, ON, and have been here for well over a year. It was just in the last month, however, that I discovered an interactive LTS map for the city developed by the not-for-profit advocacy organization Bike Ottawa. While I am mostly familiar with my new surroundings, I do occasionally use the tool when travelling outside my regular routes and would have found this to be extremely helpful during my first few months in the city. Bike Ottawa also has several other informative maps for Ottawa cyclists including an LTS Route Planner that allows you to select your desired level of stress so you can find a route that suits your cycling comfort level.
Interactive Level of Traffic Stress map for Ottawa developed by the non-profit group Bike Ottawa.
As a planner and someone who cycles almost daily, I believe that Level of Traffic Stress analysis is a vastly underrated tool that can transform how we plan our cycling networks and navigate our communities. My hope is that municipalities across Canada and around the world develop these maps to guide their network planning decisions and guide the public to their destination with a safe, convenient, and low stress route.

