Cycling infrastructure / Developments / Innovation / Innovative / Mobility management / Technology
VISSIM: A visual tool taking the guesswork out of quantifying traffic patterns
Suppose you want to know what the effects of prioritizing cyclists are on your network. You have already looked at how to distribute traffic at the network level, but what will be the effects at the intersection level?
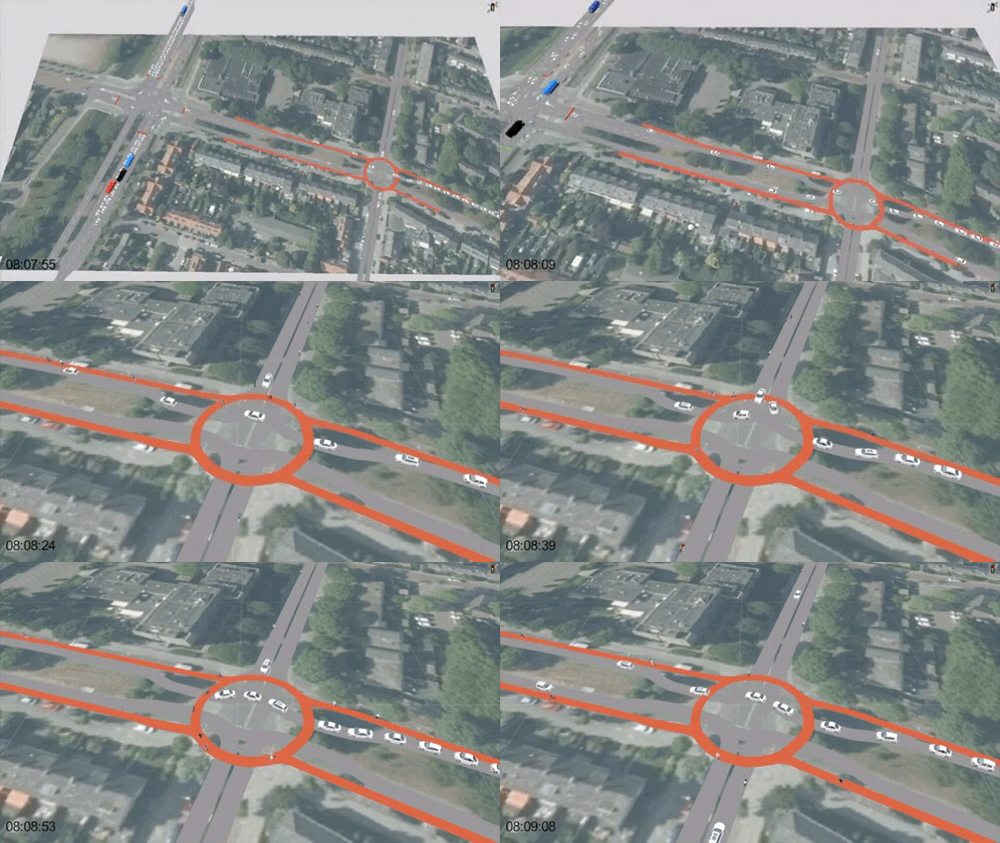
In our study of the developments in the Orionzone in Haarlem, we wanted to know how changing an intersection would impact the larger corridor. The main cycle route (north-south) was prioritized with a bicycle roundabout, meaning the dominant east-west car flow needed to give priority.
To help our client identify the impacts, we made use of the simulation program PTV VISSIM, which simulates the interactions between road users (cars, busses, trucks, cyclists and pedestrians) based on traffic patterns and the geometry of the road. With a VISSIM study, you can get quantifiable data from the program as well as a comprehensive 3D animation. In the case of Haarlem, the effects on car traffic can be quantified in travel times and queues.

Using VISSIM ultimately helps our clients, like the municipality of Haarlem, to make an informed choice. Additionally, it allows us to display the effects of any measures at the network level (like prioritizing a cycle route) understandable with visual animation. This makes it clear to both the municipality and the residents of the neighbourhood what effects can be expected.
Have more questions about VISSIM and how it can be employed to help you anticipate the effects of your planned designs? Contact Eveline de Jong, one of our VISSIM experts.

