Research
When an econometrist buys a car…
The following was originally published in Dutch for ANWB Onderweg Kampioen. For original article please click HERE.
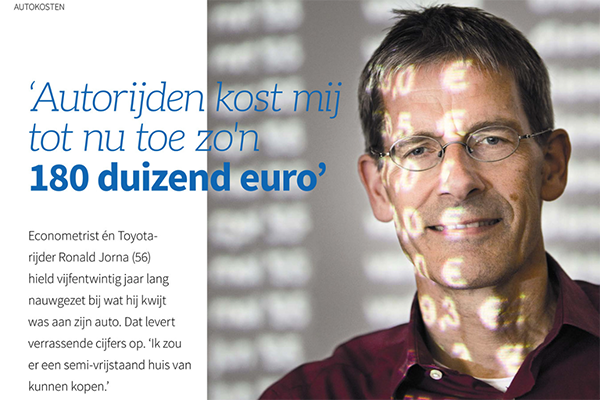
I bought my first car in November 1993, at the age of 31. As an econometrist and transport consultant, and proudly owning my first personal computer at home, I started recording all the costs and revenues of my first car, using Lotus123. When I replaced one car with the other, I continued doing so until present day, now using Excel. This resulted in 25 years of useless statistics on my car use…..


As can be seen from the table above I only bought second-hand cars, but every new car became larger and more expensive. The first 5 cars I kept for approx. 3-4 years, but when it was about time to buy a new car in 2012 the economic crisis was in full swing, so I postponed buying a new car. My current car is thus 12 years old and has over 300.000 kilometres on the clock.
Over the past 25 years I spent a staggering € 146.359 on my car, which includes all costs except parking costs. Taking into account inflation since 1993, these costs would now amount to € 179.168. For this money I can currently buy a 3-bedroom semi-detached house in my village or a 1-bedroom apartment in an Amsterdam suburb. On average I have spent annually € 7.167 on my car (see figure 1 below), which equals € 597 per month.

According to the Dutch automobile club ANWB (2014) 39% of total costs consists of taxes, which means that I have paid € 69.875 to the Dutch tax office. Not included in the total costs are the cost of the CO2 emission. These costs would amount to € 8.136 over the 25 years, based on € 60 per ton CO2.
Of course these costs strongly depend on the kilometres driven per year, which are shown in figure 2 below. Average mileage was 26.188 kilometres per year, of which 92% for private trips (including commuter trips) and 8% for business related trips.

The highest mileage was 39.306 kilometres in 2006, whereas the lowest mileage was 15.978 kilometres in 2018, a reduction of 60%, mainly realised by changing from car to train.
The total costs per kilometre are € 0,27, with the lowest being € 0,19 and the highest being € 0,37. These costs consist of four categories:

If we zoom in on the specific cost items (see figure 3), it becomes clear that the top-3 cost items are fuel, depreciation and road taxation. Of all costs 2,1% consisted of traffic fines, with an average of 2,3 fines per year. On average I drove 14,9 kilometres per litre fuel, of which 6 years gasoline and 19 years diesel.

Conclusion Analysing ownership and use of six second-hand cars over the past 25 years leads to the following conclusions:
- Owning and using a car is expensive: € 179.168 (in euros 2019) in 25 years, which is equivalent to € 7.167 per year, or € 597 per month;
- With an average mileage of 26.188 kilometres per year the costs per kilometre are € 0,27;
- Major cost items are fuel (32%), depreciation costs (29%) and road taxation (16%);
- Costs of diesel increased on average from € 0,97 in 1994 to € 1,35 in 2018 (prices in euros 2019);
- A modal choice is your own choice: since 2006 I managed to reduce mileage with 60%, mainly by shifting commuter and business trips from car to train.
If you would like to read more about this, you can also read: https://www.mobycon.nl/blog/wanneer-eeneconometrist- naar-zijn-werk-fietst/when-an-econometrist-goes-towork- on-his-bicycle/

Ronald Jorna
‘ICT makes the transport chain more intelligent, which contributes to more efficient and sustainable transportation. As a staunch advocate for smart travel, I investigate how ICT can increase the safety and comfort of cyclists. European cooperation and knowledge sharing are important to this work. The choice for a certain modality is a trade-off between time, cost, quality of life and health.’
Senior Advisor ICT and Freight Specialist
r.jorna@mobycon.com

